
Using the Mannarino Market Risk Indicator (MMRI) to Gauge Risk in the Stock Market
The Mannarino Market Risk Indicator (MMRI) was developed by derivatives and options trader Gregory Mannarino, to gauge risk in the United States stock markets.
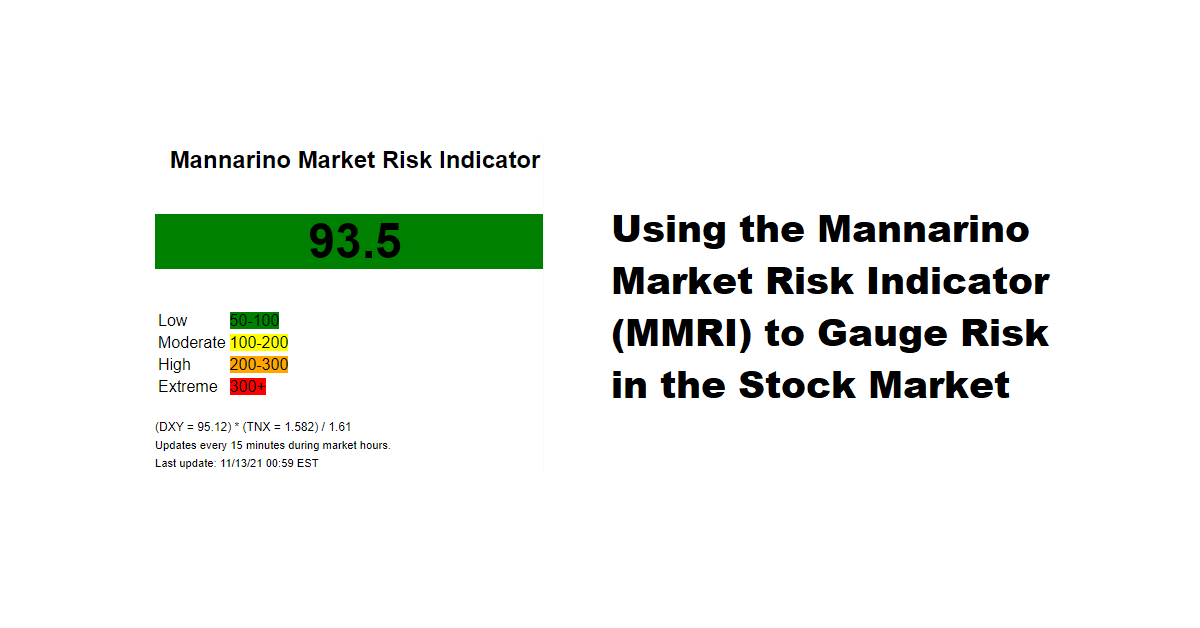
The formula to calculate the MMRI is:
MMRI = (US Dollar Index DXY * 10-year US Treasury Bond Yield) / 1.61
How to Interpret the MMRI?
The MMRI indicator is interpreted based on a scale ranging from 50 to 400.
50 to 100 = Low Risk
100 to 200 = Moderate Risk
200 to 300 = High Risk
Greater than 300 = Extreme Risk
| Mannarino Market Risk Indicator (MMRI) Values During Significant United States Stock Market Crashes 1987 to 2008* | |
| 1987 Stock Market Crash “Black Monday” | 488 |
| 2000 Stock Market Crash “Dot-Com Bubble Burst” | 360 |
| 2008 Stock Market Crash “Global Financial Crisis” | 200 |
| Data Source: Mannarino Market Risk Indicator. Gregory Mannarino. https://steemit.com/bitcoin/@marketreport/mannarino-market-risk-indicator-by-gregory-mannarino | |
Analysis
The MMRI is an effective tool to gauge market risk and may be used in a global context for all credit-derived markets including stock markets and real estate. Caution is advised, in particular when the indicator approaches the High Risk territory > 200.
A live feed of the MMRI can be viewed on this page or on the Vita Columbia Economics Research homepage.
____________________________________________________________________________________________________________
Disclaimer: All contexts of blog posts are based solely upon the analysis and opinion of the author and are not intended to construe any financial advice in any form.
Joy says:
Important to note the gauge is not saying what will happen but probabilities based on historic market
data. The MMRI should only be seen as a tool and not the sole thing one looks at when making investing
decisions.